Seeing Everything, Understanding Nothing: The Visibility Trap Slowing Down Your Engineering Team

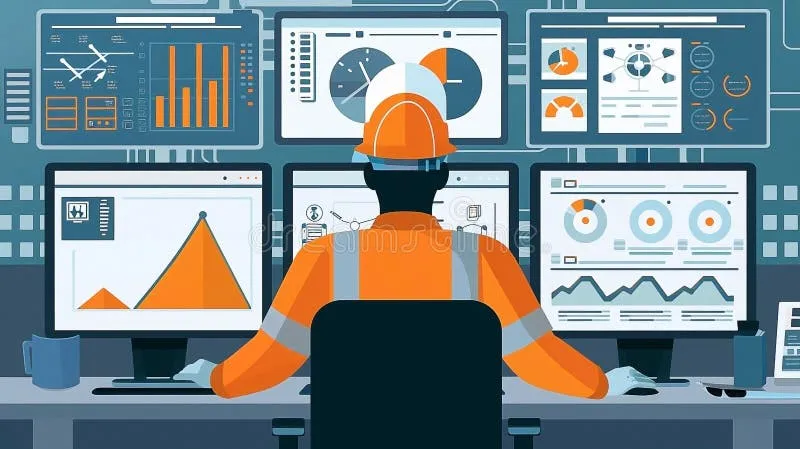
There's a particular kind of frustration that sets in around 2 a.m. during a production incident. Your observability platform is lit up like a Christmas tree — hundreds of correlated alerts, a cascade of dependency traces, service maps pulsing red across three regions. You have complete visibility into your system. And yet nobody on the call can agree on where to look first.
This is the observability paradox in its purest form. The very tools built to give engineering teams clarity are, under the wrong architecture, generating the exact opposite: noise-induced paralysis.
When More Data Becomes the Problem
The pitch from modern observability vendors is compelling. Full-stack tracing. Real-time log correlation. Dependency graphs that auto-discover every service talking to every other service. It sounds like a precision instrument — a quiver full of exactly the right arrows for any situation.
But here's what actually happens in practice. Teams instrument everything. Dashboards multiply. Alert rules get copy-pasted from runbooks written for different architectures. Over time, the observability layer becomes its own distributed system, complete with its own failure modes and maintenance burden.
A 2023 survey from the DORA research program found that high-performing engineering teams don't necessarily use more observability tooling than their peers — they use it more deliberately. The distinction matters. Instrumentation without intent is just expensive noise generation.
The Correlated Signal Problem
One of the sneakier failure modes in modern observability stacks is what you might call the correlation avalanche. Your platform detects an anomaly in service A, which triggers related alerts in services B, C, and D — all of which are downstream dependencies. Each alert is technically accurate. Each correlation is real. But now your on-call engineer is staring at forty alerts instead of one, and the actual root cause is buried somewhere in the middle.
This is a signal-to-noise ratio problem, not a data collection problem. And the instinct to fix it by adding more instrumentation — more granular traces, more detailed logs — usually makes things worse before it makes them better.
The engineers who navigate incidents fastest aren't the ones with the most dashboards. They're the ones who've built observability around a clear mental model of what "normal" looks like and what deviations actually require human attention.
Architecting for Action, Not Comprehension
So what does intentional observability actually look like? It starts with a reframe: stop building observability systems designed to answer every possible question, and start building systems designed to answer the right questions fast.
Here's a practical framework for getting there:
Define Your Critical Path First
Before you instrument anything, map the critical paths in your system — the sequences of operations that directly affect user experience or business outcomes. These are your tier-one observability targets. Everything else is tier two or three, and it should be treated accordingly in your alerting logic.
A payment processing service warrants aggressive, low-latency alerting. An internal reporting job that runs nightly probably doesn't need to wake anyone up.
Build Alerts Around Symptoms, Not Causes
One of the most common observability anti-patterns is building alerts around infrastructure metrics — CPU usage, memory consumption, disk I/O — rather than user-facing symptoms. Your users don't care that a pod is at 80% CPU. They care that checkout is taking twelve seconds.
Symptom-based alerting forces you to think about observability from the outside in. It reduces alert volume dramatically, and it makes the alerts that do fire immediately actionable because they're tied to something a human can understand and prioritize.
Treat Cardinality as a First-Class Concern
High-cardinality data — traces tagged with user IDs, request paths, or session tokens — is incredibly powerful for debugging. It's also incredibly expensive if you're storing and indexing all of it indiscriminately. Teams that don't manage cardinality deliberately end up either paying enormous observability bills or, worse, sampling away the exact data they need during a high-traffic incident.
Design your data retention and sampling strategies intentionally. Keep high-cardinality data for short windows. Aggregate aggressively for long-term trend analysis. Don't let your observability vendor's default settings make these decisions for you.
Create Runbook-Aligned Alert Hierarchies
Every alert that fires should map to a runbook — a documented response procedure that tells an on-call engineer exactly what to check and what to do. If you can't write a runbook for an alert, the alert probably shouldn't exist.
This constraint is useful precisely because it's uncomfortable. It forces teams to confront how many of their alerts are aspirational rather than actionable. Alerts that exist because someone once thought "it'd be good to know if this spikes" are the primary driver of alert fatigue.
The Human Cost of Visibility Overload
Alert fatigue is a well-documented phenomenon in software operations, but it's worth sitting with the human dimension of it for a moment. When engineers are conditioned by months of noisy, low-signal alerts, they start to develop a kind of learned helplessness around incident response. The alerts become background noise. The dashboards become wallpaper.
By the time a genuinely critical incident fires, the team's instinct is to wait and see if it resolves itself — because that's what 80% of the other alerts did. That's not a people problem. That's an architecture problem.
Less Is a Precision Choice
The teams getting incident response right in 2024 aren't the ones with the most sophisticated observability stacks. They're the ones who've made hard editorial choices about what their systems need to communicate and what can safely go unmonitored.
That kind of restraint is counterintuitive in an industry that defaults to "instrument everything and figure it out later." But precision — knowing exactly where to look and why — is what separates a team that resolves incidents in minutes from one that spends hours chasing cascading alerts across a system map.
More visibility is only valuable if it sharpens your aim. Otherwise, you're just carrying more arrows you'll never use.