The Cracks You Can't See: Infrastructure Failure Modes That Only Show Up When You're Growing Fast
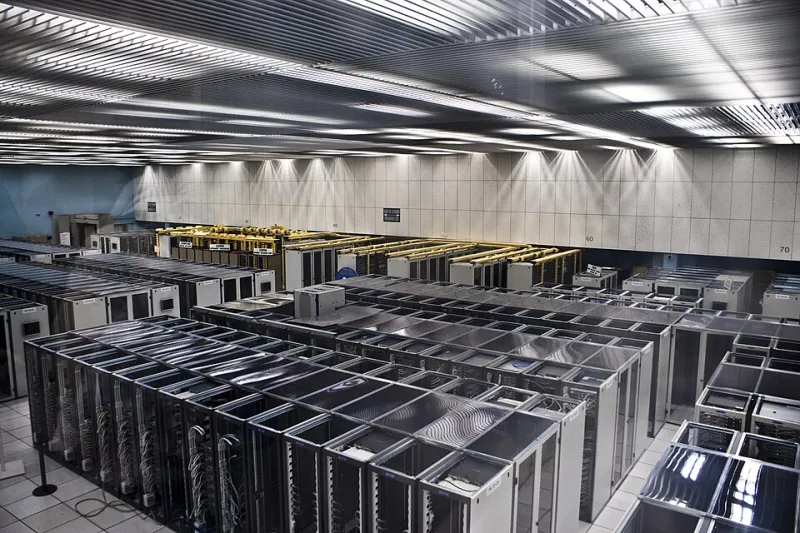
Photo: Florian Hirzinger - www.fh-ap.com, CC BY-SA 3.0, via Wikimedia Commons
Let me paint a picture that will feel uncomfortably familiar to anyone who's been on-call during a growth spike. Your product just got featured somewhere big — a newsletter, a podcast, maybe a mention from someone with a large following. Traffic is climbing. The team is excited. Then, about forty minutes in, things start getting weird. Not broken, exactly. Just... slow. Then slower. Then a few users report errors. Then your on-call phone lights up and you're spending the next six hours trying to figure out why a system that handled 10x this load in your load tests is falling apart at 3x real-world traffic.
The culprit is almost never what you expect. It's not the database. It's not the application servers. It's something adjacent, something foundational, something that was never on anyone's radar because it had never been a problem before. That's the nature of hidden scaling failures — they're invisible until they're not, and by the time they're visible, you're already in an incident.
I've been thinking about this a lot lately, particularly as more US companies push hard into digital transformation and start running workloads at scales they weren't originally designed for. The conversation around scaling tends to focus on the glamorous stuff: distributed systems design, horizontal scaling, microservices. But the failures that actually take companies down during growth phases are usually far more mundane.
The Connection Pool Trap
Database connection pooling is one of the most underappreciated bottlenecks in modern application infrastructure. Here's the basic shape of the problem: your application servers spin up to handle increased load, each one establishing connections to your database. But databases have hard limits on concurrent connections — PostgreSQL defaults to 100, and even with tuning, you're not getting to infinity. Add a connection pooler like PgBouncer and you buy yourself some headroom, but misconfigure it and you've just moved the bottleneck one layer up.
The insidious part is that connection exhaustion doesn't always look like a database error. It can manifest as slow response times, request queuing, or timeouts that your monitoring attributes to application latency rather than infrastructure limits. Teams spend hours profiling their query performance while the actual problem is that new connections are waiting in line to be established.
The fix is less about adding capacity and more about understanding your actual connection patterns. How many connections does each service instance need? What's your peak concurrency per pod? Are you holding connections open longer than necessary? These are questions most teams haven't answered explicitly, which means they discover the answers during incidents instead of planning sessions.
DNS: The Scaling Failure Nobody Talks About
DNS resolution is so fundamental to how the internet works that most engineers treat it as a solved problem. It's not. At scale, DNS becomes a genuinely interesting failure domain, and the failure modes are strange enough that they can be hard to diagnose.
Here's a scenario that plays out more often than you'd think. A company scales up its microservices footprint — more services, more internal service discovery, more DNS lookups per request as services call other services. Their DNS resolver, which was perfectly adequate for their previous scale, starts getting hammered. Resolution times creep up. Because DNS failures are often silent (the resolver retries, the application eventually gets an answer), the symptom looks like general latency rather than a DNS problem. By the time someone thinks to check DNS metrics, the resolver is the bottleneck for a meaningful fraction of all inter-service communication.
Cloud environments add another wrinkle: the default DNS resolver in most cloud VPCs has a rate limit. On AWS, it's 1,024 packets per second per network interface. That sounds like a lot until you're running a dense microservices architecture where every request fans out to eight services, each making its own DNS lookups. The math starts working against you faster than intuition suggests.
Cloud Billing as a Scaling Signal
This one sits at the intersection of infrastructure and finance, which is probably why it gets missed by both engineering and finance teams. Cloud billing anomalies — sudden spikes in data transfer costs, unexpected charges for API calls to managed services, storage costs that scale non-linearly with user growth — are often early signals of architectural inefficiencies that will eventually become performance problems.
A company that's pulling large amounts of data out of S3 to process it in-region might not notice the egress costs until they're significant. But those costs are also telling you something about data movement patterns that could be causing latency at scale. The billing dashboard is, in a weird way, an observability tool — it shows you where your system is doing expensive things, and expensive things are often slow things.
Building a habit of reviewing cloud cost anomalies as part of your engineering process, not just your finance process, gives you a leading indicator of scaling problems before they manifest as performance degradation.
A Diagnostic Framework for the Stuff You Haven't Checked
If you're reading this and feeling a low-grade anxiety about what might be lurking in your own infrastructure, that's the right response. Here's a starting point for a hidden-bottleneck audit.
First, map your hard limits. Not your soft targets or your SLOs — the actual hard limits imposed by your infrastructure components. Database max connections. DNS resolver throughput. Load balancer connection limits. Cloud service API rate limits for services you depend on. Write them down. You'll probably find at least one that surprises you.
Second, stress test the adjacencies. Most load testing focuses on the primary application path. Extend it to include the supporting infrastructure — DNS resolution times under load, connection pool behavior at peak concurrency, behavior of your caching layer when the cache is cold.
Third, instrument the boring stuff. Connection pool utilization, DNS resolution latency, and cloud API error rates are not exciting metrics, but they belong in your observability stack alongside the application metrics everyone already tracks.
Growth should feel like winning. With the right visibility into the infrastructure layers that most teams ignore, it actually can.